The Dashboard
Overview
The Dashboard is the main user interface for EverbriteCONNECT, showing the system status and links to all diagnostic and configuration pages. The Dashboard contains the following components:
Header Bar
The Header Bar is present on most screens, including the dashboard.

Header Bar Icons:

Menu Icon - When pressed, the menu is presented - See below for details on the Menu screen.
Note
When using the Web Portal on a sufficiently large screen, the menu icon will not be visible and instead, sidebar items will be visible by default.
EverbriteCONNECT Logo - When pressed from any screen, you will be returned to the dashboard.

Status Icon - Warning - Console Only. Indicates an error in the sign, console, or communication. Tap to view more information. Icon will persist for up to 5 minutes after an error is encountered.

Status Icon - Activity - Console Only. Indicates active communication between your console and your sign. This icon will not be visible when the console is not actively communicating with the sign.

Profile Icon: Shows your name and allows you to log out of your account. Options differ when using the Console or Web/Mobile app. Not visible if operating the console in Unlocked mode.
Profile Icon - Web/Mobile: Additional options are available on Web/Mobile:

User Settings - Allows you to edit your account.
Reset Password - Allows you to change your password by sending yourself a password reset email.
Log Out - Log out of EverbriteCONNECT
User Settings

Allows you to edit your name, email address, and phone number
Delete Account
Permanently deletes your EverbriteCONNECT account and all stored personal information. WARNING This cannot be reversed!
The Menu - Web/Mobile
When utilizing the EverbriteCONNECT Web Portal or mobile app, pressing the  icon on the Header Bar loads the Menu:
Note
These items are only available when using EverbriteCONNECT via the Mobile App or the Web Portal. Only the Dashboard will be visible unless you are a Customer Admin.

Customer Account - Displays the company account name for the company that administrates your account
Dashboard - Returns you to the Dashboard.
Manage Locations - Brings you to the Location/Group Management screen.
Manage Users - Brings you to the User Management screen.
The Menu - Console
Pressing the icon on the Header Bar on the console loads the Menu:

Menu Icons:
Customer Account - Displays the company account name for the company that administrates your EverbriteCONNECT account

X Icon - Hides the Menu. You can also press the Menu Icon to hide the menu.

Dashboard - Returns you to the Dashboard.

Log Viewer - Opens the Log Viewer. See Console Logging for more information.
Setup Wizard - Opens the Setup Wizard - See Setup Wizard section for more information
Software Version - Displays your console software version. This information is also available under Location Console on The Dashboard.

Refresh - Re-syncs the console with your sign(s). Note that your console will automatically sync with your sign when changing settings/pricing, and at regular intervals.

Lock/Unlock - Provides the following authentication methods for the console:
Locked Mode - Console will remain connected to EverbriteCONNECT to enable heath monitoring and remote control. EverbriteCONNECT login will be required at power-on and every 24 hours for security purposes. Everbrite recommends utilizing this setting to ensure that only authorized users may make changes to sign pricing, captions, and other settings
Unlocked Mode - Console will not require a login at power-on, remains connected to EverbriteCONNECT services over the internet. Many console and sign configuration items are disabled in this mode. Any person with physical access to the console will be able to make changes to sign pricing, captions, and other settings

Shutdown Options - Provides shutdown options for the console. See Hardware & System Overview for methods of shutting down and rebooting the console with the physical button
Power Off - Safely shuts down console. Console will remain off until the power button is pressed.
Reboot - Safely shuts down console, and then restarts it.
Dashboard View - Multi-Location
Web and Mobile-Only
This feature is only available on the web and mobile app for users with access to multiple locations with EverbriteCONNECT consoles.
Users with access to multiple locations with EverbriteCONNECT consoles will have access to a dashboard showing a summary of all of the locations they have access to.

You can search by store name, address, or store number to filter the stores displayed
All locations your account have access to are displayed here, showing the current pricing configuration and health status. To view and edit site-specific information, press the location you would like to view/edit.
Dashboard View - Single Location
Selecting an individual location from the Multi-Location Dashboard view will bring you to the Dashboard for the location in question. The EverbriteCONNECT Console will default to this view.
The Dashboard contains complete system status information, configuration options, and diagnostics. The Dashboard contains the following main components:
Location Pricing
Location Pricing contains the configuration (including pricing) for all of your products and grades.
Note
Displayed pricing reflects the currently configured values for your products. To see the pricing figures last reported as displaying on your sign, see Location Sign
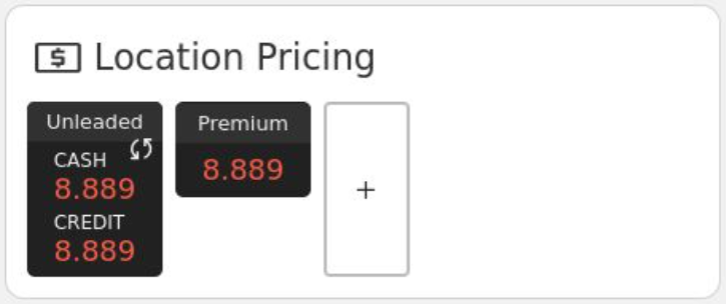
Pressing a grade or the + icon will take you to the Location Pricing screen
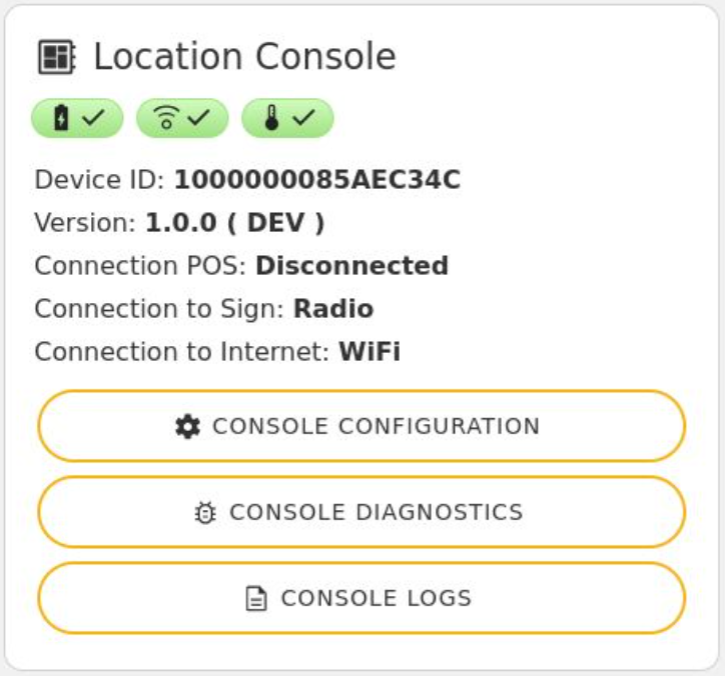
Location Console
Location Console displays the current health of your console. It also contains certain global configurations for your console such as bright/dim levels, as well as diagnostic tools and logs for the console.
Press Console Configuration to edit Console Configuration information
Press Console Diagnostics to access Console Diagnostics tools
Press Console Logs to view the Console Logging
Console Health Badges
These badges display the current health of your LumiConsole’s battery, radio, and temperature. Pressing an icon will bring up Health Metric History for the metric in question.
A green icon represents good health and optimum performance.
A yellow icon represents a warning condition that a value is out of the optimum range and may require attention
A red icon represents a critical condition that requires immediate attention to maintain console performance
A white icon indicates no current data is available. Check back in 15 minutes.
For help troubleshooting warning or critical states, see the Common Issues section

Battery Level - Displays the current charge level of the console’s onboard battery.

Console Radio - Displays the current health of the signal your console is receiving from your sign(s).

Console Temperature - Displays the current health of the console’s internal temperature.
Console Information
Device ID: - A unique hardware ID associated with your console
Version: - The current software version running on your LumiConsole
Connection POS: - Displays whether your system is currently communicating with your Point of Sale system, if applicable. Locations that do not have console integration with the Point of Sale system will always show Disconnected.
Connection to Sign: - Dispalys Radio for a wireless connection to your signs, or Wired for a hardwired connection to your signs.
Connection to Internet: - Displays whether your console is configured to connect to the internet via Ethernet or WiFi, or if the console is configured for Offline Mode.
Location Sign
Location Sign contains current health information for your LumiDigit® and/or LumiText™ sign(s), current pricing displayed on your sign(s), as well as diagnostic tools for your sign(s). Locations with multiple signs will have multiple signs listed. This section is broken into two sections: Sign Information and Priceline Information
Sign Information

Press Sign Configuration to edit the name of your sign as displayed on the Dashboard
Press Sign Diagnostics to access Sign Diagnostic tools.
Sign Health Badges
These badges display the current health of your LumiDigit® sign’s radio, temperature, and voltages. Pressing an icon will bring up historical data for the metric in question.
A green icon represents good health and optimum performance.
A yellow icon represents a warning condition that a value is out of the optimum range and may require attention
A red icon represents a critical condition that requires immediate attention to maintain console performance
A white icon indicates no current data is available. Check back in 15 minutes.
For help troubleshooting warning or critical states, see the Common Issues section
Temperature - Displays the current health of the sign or priceline digit’s internal temperature.
Sign Radio - Displays the current health of the signal your sign is receiving from your console.

Voltage - Displays the current health of the sign’s input voltage.
Priceline Information
Priceline Information displays configured priceline(s) for the sign, health information for the digits, the ability to set discount groups, and a view of the last reported pricing displayed on your sign.

A Discount Group can be applied by pressing the dropdown and selecting the associated discount group. Note that this cannot be applied to alternating pricelines.
The last reported values displayed on the sign for the given pricelines and caption are displayed. If there is a mismatch between the pricing configured in Location Pricing and what is reported by the sign, a
 icon will appear. This can be pressed for more details. See Common Issues for more details.
Priceline Health Badges
These badges display the current health of each priceline’s digit temperature and input voltage. Pressing an icon will bring up Health Metric History for the metric in question.
A green icon represents good health and optimum performance.
A yellow icon represents a warning condition that a value is out of the optimum range and may require attention
A red icon represents a critical condition that requires immediate attention to maintain console performance
A white icon indicates no current data is available. Check back in 15 minutes.
For help troubleshooting warning or critical states, see the Common Issues section
Temperature - Displays the current health of the priceline digit’s internal temperature.
Voltage - Displays the current health of the priceline digit’s input voltage.
LumiText™ Display
LumiText Display contains current health information for your LumiText sign(s), as well as displaying the current playlist assigned to your sign(s) and a preview.
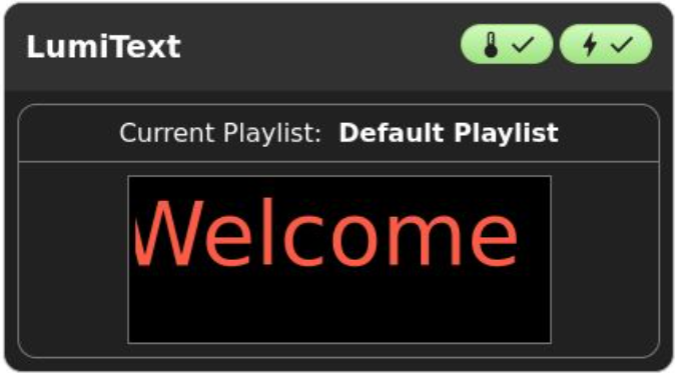
To manage the messages and schedules for your LumiText™ Electronic Message Center, press anywhere in the Current Playlist or Preview area to enter the Playlist Configurator.
LumiText™ Health Badges
These badges display the current health of your LumiText Sign’s controller temperature and input voltage. Pressing an icon will bring up Health Metric History for the metric in question.
A green icon represents good health and optimum performance.
A yellow icon represents a warning condition that a value is out of the optimum range and may require attention
A red icon represents a critical condition that requires immediate attention to maintain console performance
A white icon indicates no current data is available. Check back in 15 minutes.
For help troubleshooting warning or critical states, see the Common Issues section
Temperature - Displays the current health of the LumiText controller’s internal temperature.
Voltage - Displays the current health of the LumiText controller’s input voltage.